Sunday, May 23, 2010

M6A2ae: Proportional Relationships (3)

M6A2. Students will consider relationships between varying quantities.
a. Analyze and describe patterns arising from mathematical rules, tables, and graphs.
e. Graph proportional relationships in the form y = kx and describe characteristics of the graphs.

In the previous post, we analyzed the ways two quantities that are in a proportional relationship using a table. Today, we want to look at the idea of analyzing proportional relationships - and identifying features that are unique to proportional relationships - using graphs. So, let's consider one of the relationship we talked about last time:

When you graph this set of data, it will look like this:

Since these quantities are both continuous quantities, we can actually connect the data points using a line (actually a ray):

Let's compare this graph to graphs of three other situations. The first one is the siblings' ages.

The second situation is the candle situation: the length of candles burned and the length of the remaining candle.

The last case is the length and the width of rectangles with a fixed area measurement.

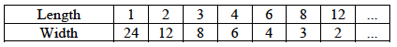
Since the first situation involves the discrete quantities - and since I don't know how to graph the curve for the last one, I am just going to plot these data points.


When you compare these graphs to the graphs of the proportional relationship from earlier, you immediately notice that the graph of the inverse proportional situation isn't a straight line. However, the other three situations seem to result in straight lines. Although it is not really appropriate to use a line to represent the siblings' ages data with a straight line, I'm going to do so to illustrate the similarities and differences - and I'm showing all three lines on the same coordinates.

From these graphs, we noticed that one difference seems to be that the graph of the proportional situation goes through the origin, but not the other two. As it turns out this is indeed unique to proportional situations. The other two cases, constant sum and constant difference situations, result in a straight line. One commonality among the three situations is that the rate of change is constant. Thus, the characteristic of the data sets that are represented in straight lines. I think this might be an idea that is worth discussing explicitly in Grades 7 and 8 when linear equations/functions are studied more formally.

By the way, the fact that the graphs of proportional relationships go through the origin relates to the fact that double number lines we use to represent multiplication and division situations are "hinged" at 0 - in other words, both quantities will go to 0 at the same time. In fact, proportional relationships are assumed in all multiplication and division situations. In middle grades, that fact should become explicit instead of being an implicit assumption.

Saturday, May 8, 2010

6A2a: Proportional Relationships (2)

M6A2. Students will consider relationships between varying quantities.
a. Analyze and describe patterns arising from mathematical rules, tables, and graphs.

In the previous post, I discussed how we can analyze situations where two quantities are changing simultaneously. From that analysis, we defined what a proportional relationship was - two quantities are in a proportional relationship if the quantities change in such a way that their quotient stays constant. This relationship may be represented as y÷x = k, or y = kx, where k is the constant.

Let's think about how else this relationship may be seen by looking at a couple of specific instances. The two proportional situations we discussed last time were:
c) the distance traveled and the time of travel (at a constant speed), and
f) the amount of meat and the price of meat
The tables below show the values of these quantities:


So, what commonalities do you notice about the way quantities are changing in these tables? One thing students might see quickly is that, in both situations, the quantity are changing by the same amount. In this case, both time and amount are increasing by 1 unit as you go from left to right. The distance is increasing by 3 miles while the price is increasing by $4.50. Of course, this observation is really the function of the way we listed these quantities. We could have skipped some instances like this:

Or, we could have listed these pairs unordered:

So, one thing student can learn, more generally about collecting and displaying data, is that when we organize them systematically, we might be able to observe patterns more easily. But, is there any relationship we can observe in these tables even if the data are not organized as neatly?

Let's look at the way the distance changes as the time goes from 4 hrs to 8 hours, 5 hours to 10 hours, 15 hours and 30 hours. In other words, what happens to the distance as the time doubles? What about the price as the amount of meat doubles? What if we the time changed from 10 hours to 30 hours, or 30 hours to 90 hours - i.e., if the time becomes 3 times as long? What if the amount of meat changes from 1 pound to 4 pounds, 2 pounds to 8 pounds, 3 pounds to 12 pounds - i.e., if the amount of meat becomes 4 times as much?

In these proportional situations, when one quantity becomes 2, 3, 4,... times as much, the other quantity is also becoming 2, 3, 4,... times as much. Let's see if that is also the case in other situations. Since the constant quotient relationships is an increase-increase situation, we really don't have to consider an increase-decrease situation. So, the only other increase-increase situation was the constant difference situation. So, let's look at the ages of two siblings shown in the table below:

So, when Ariel becomes twice as old, will Desmond also becomes twice as old? For example, if Ariel's age goes from 10 years old to 20 years old, what happens to Desmond's age. When Ariel is 10 years old, Desmond is 13 years old. That tells us that Desmond is 3 years older than Ariel. So, when Ariel is 20 years old, Desmond will be 23 years old. Clearly 23 is not the double of 13. So, what we noticed about the proportional relationships above is indeed unique. In fact, in most, if not all, Japanese textbooks, proportional relationship is defined using this characteristic: Two quantities are in a proportional relationship if as one quantity becomes 2, 3, 4, ... times as much, the other quantity also becomes 2, 3, 4, ... times as much.

In the same way, Japanese textbooks define inverse proportional relationships this way: Two quantities are in an inversely proportional relationship if as one quantity becomes 2, 3, 4, ... times as much, the other quantity becomes 1/2, 1/3, 1/4, ... times as much. As I stated last time, it is important that students compare and contrast these various situations from the same angle so that they can identify what characteristics are unique to proportional relationships. So, I think it would be useful for students to analyze a variety of situations from this particular perspective, i.e., when one quantity becomes 2, 3, 4, ... times as much, what happens to the other quantity.

Creative Commons

Creative Commons License
Elaboration of Georgia Performance Standards by Tad Watanabe is licensed under a Creative Commons Attribution-NonCommercial-ShareAlike 3.0 Unported License.